 Volition
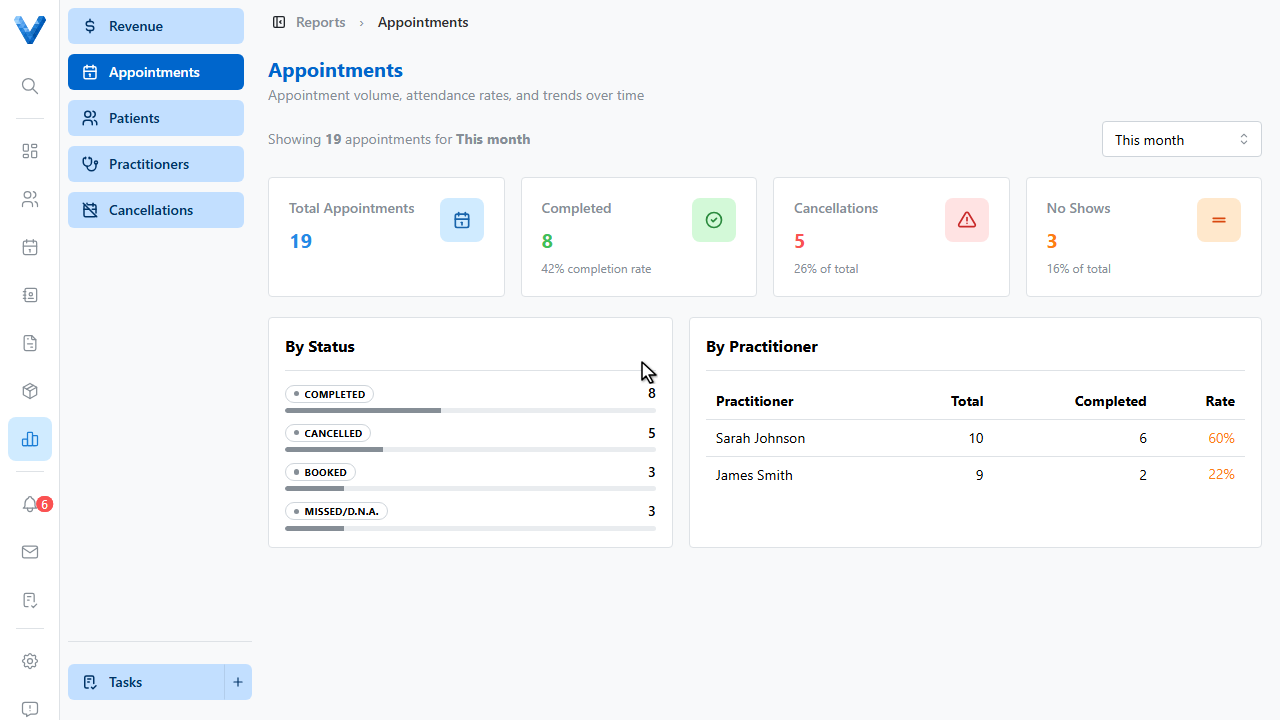
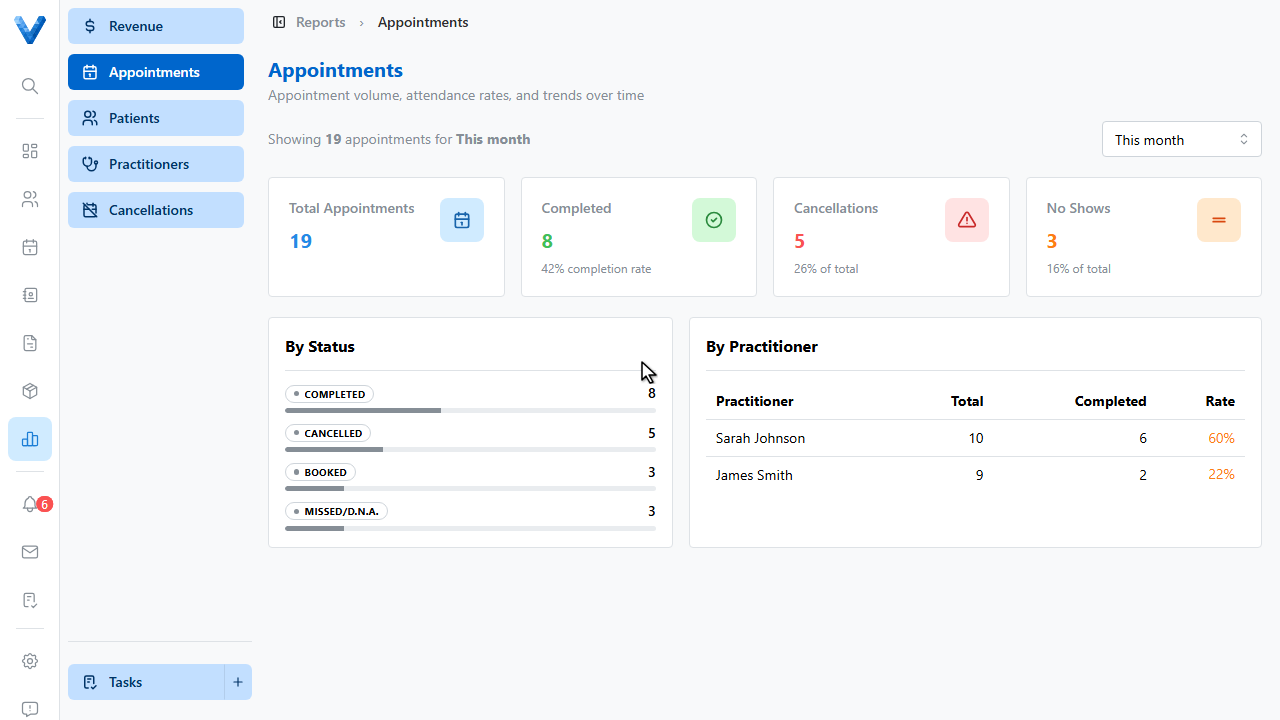
Beyond revenue, four more reports round out the picture. The Appointments report shows totals, completions, cancellations, and no shows, broken down by status and practitioner.
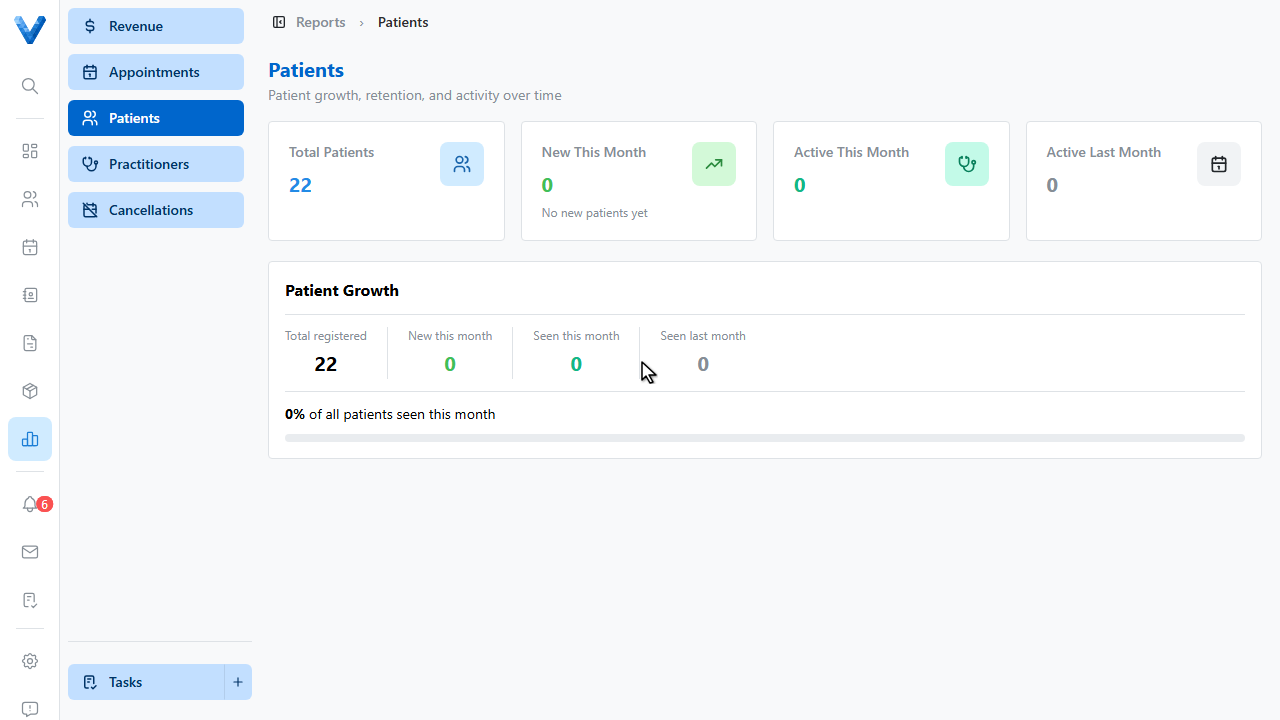
The Patients report tracks growth — new patients this month and how many are active.
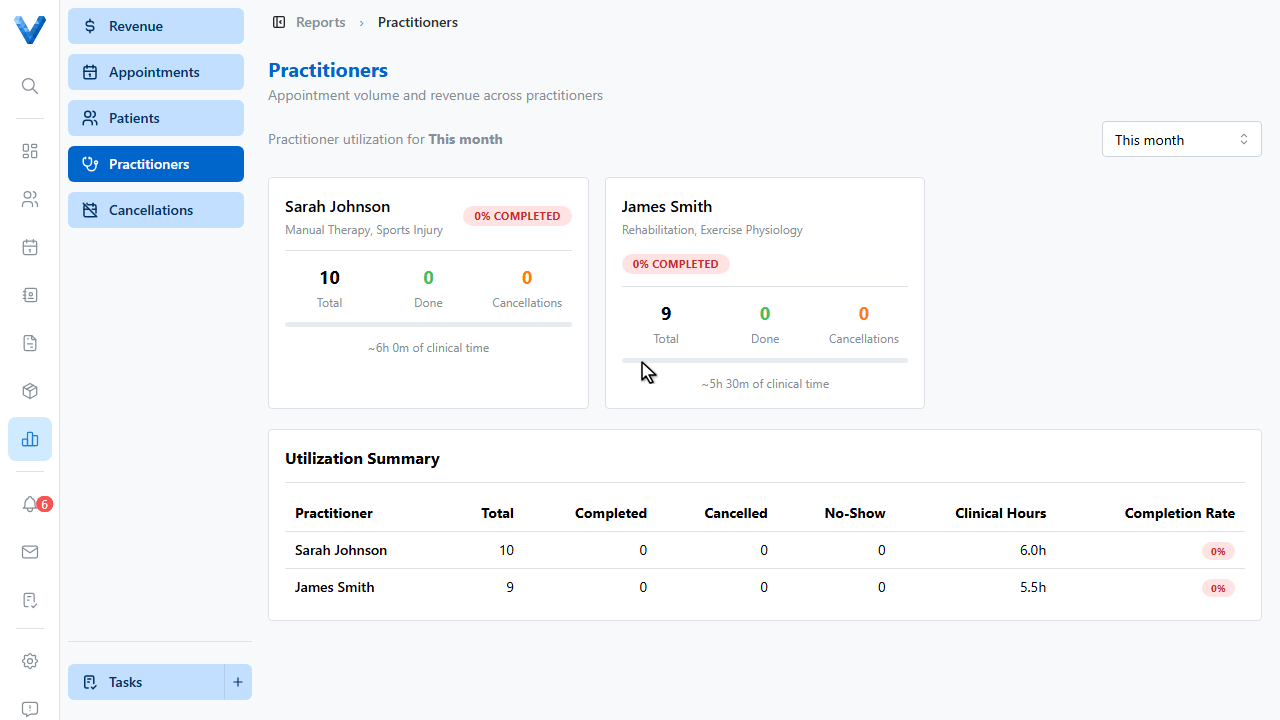
Practitioners shows utilisation — appointments completed, clinical hours, and completion rate per practitioner.
And Cancellations and No shows tracks attendance — the combined rate, and which practitioners and appointment types are affected most.
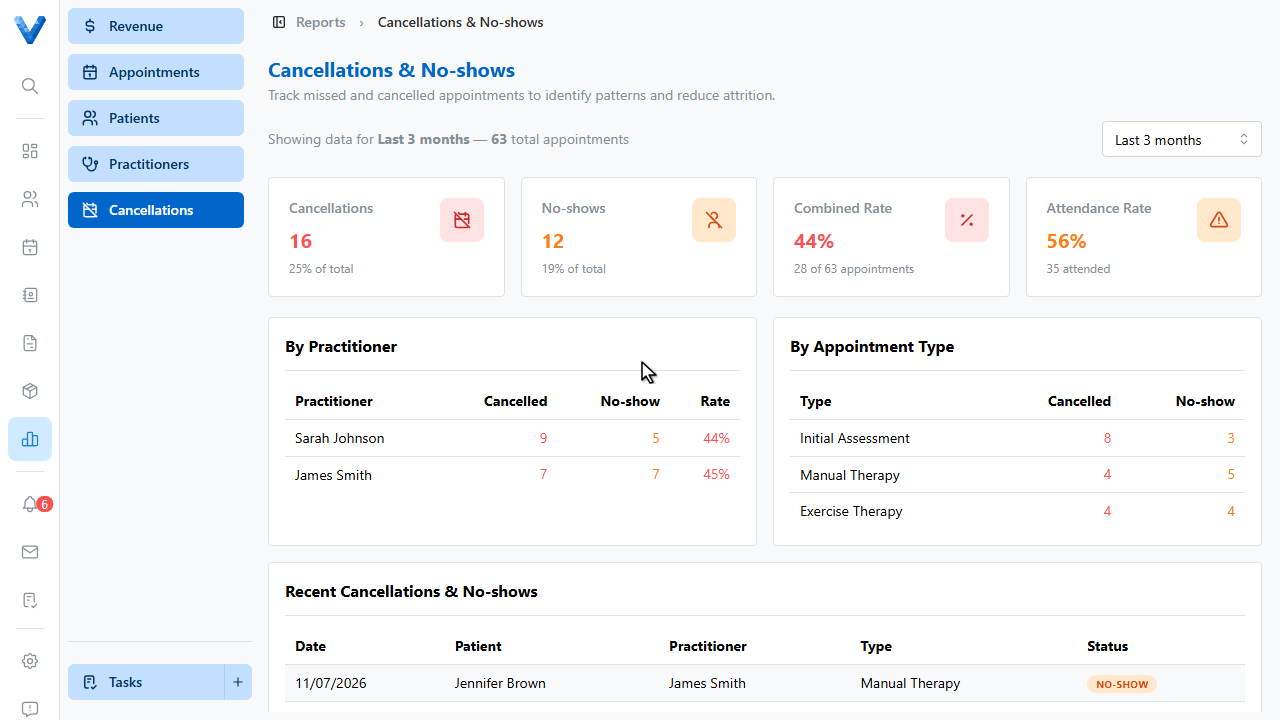
Pair this one with automatic reminders — if the no show rate climbs, tighten the reminder schedule.
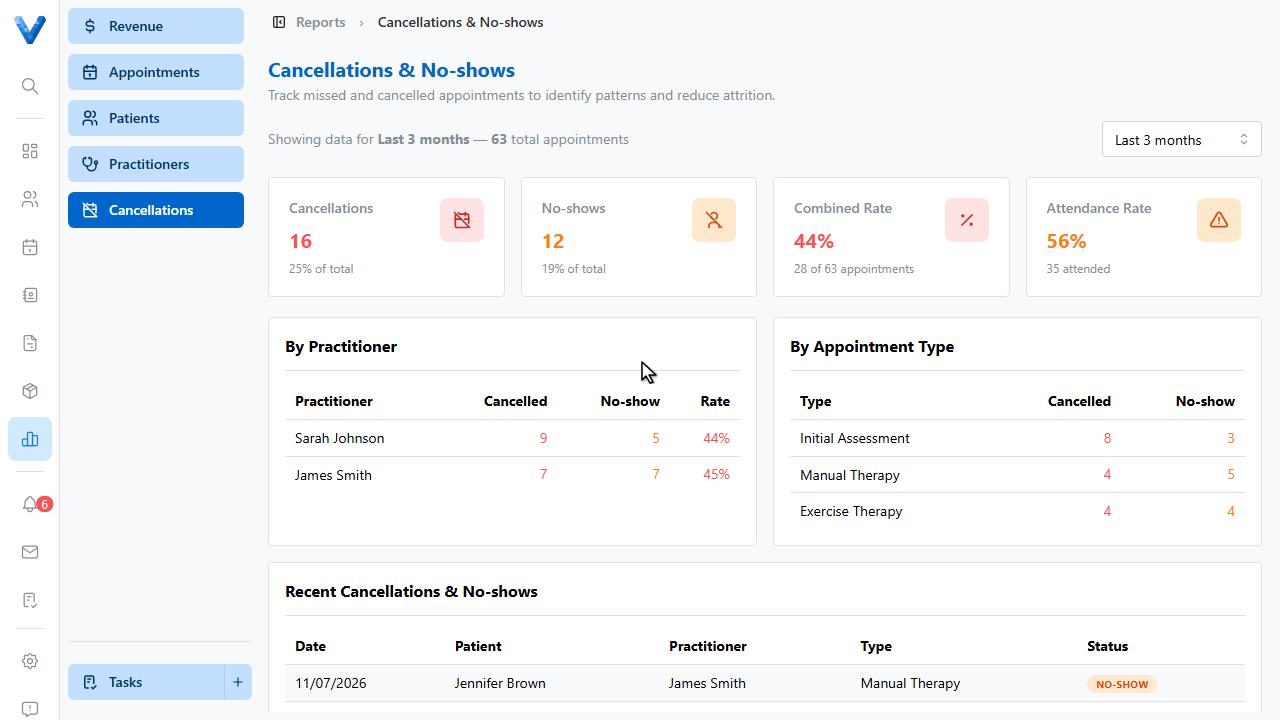
High no-shows? Tighten the reminder schedule. Low utilisation? Check the practitioner’s working hours and online-booking visibility. Each report pairs with a setting that moves it.